Roulette Wheel and Tile Design.
After it was decided that we would not make a Vending Machine , the teachers decided to make a roulette wheel and tiles. Each group would be responsible for designing one tile and one triangular piece for the roulette wheel. I came up with several designs for the Three final products would be made. A video for Humanities and Chemistry and a tile and a roulette wheel for Art.
The images above are my ideas for my group triangle portion of the roulette wheel. The first two were my original ideas. They did not make sense to elementary schoolers. I made new images that communicated the same message but were easier for younger students to understand.
In addition to drawing all of the images for the roulette wheel, I also wrote up text that could go on the roulette wheel. This was supposed to be a short but informative writing piece that provided enough information for the elementary schoolers about our group topic while also intriguing middle and high school students to watch our video. I wrote several possible pieces that might possibly go on the roulette wheel.
Here is my first writing piece:
Ever wonder how much H2O is used to make food in CA and if it's sustainable?
Well, CA. is the biggest producer of food in the USA. It makes foods ranging from almonds to beef. The one thing that they all have in common? They use H2O, and lots of it. As of 2013, Ca. uses 34 mil. acre ft. of H2O for agriculture.
Scan to learn more.
This writing piece was good because it fit on the roulette wheel. However, I did not think that it clearly communicated enough information about my group topic. As a result, I wrote a longer, more informative version. Here it is:
Ever wonder how much H20 is used
to make food in California and if it’s sustainable?
California is the biggest producer of food in the United states and one of the biggest producers of food in the world. California also produces a wide range of different food products including, strawberries, nuts, dairy products, and beef. It produces 80% of the country’s strawberries and 80% of the world's almonds. Agriculture is great for California’s economy, resulting in 46.4 billion dollars of total revenue in 2013.
Unfortunately, California is also trudging through the fourth year of a drought that shows no signs of ending. The overused Colorado River is at it’s lowest level in recorded history, the Delta in northern california is drying up and imported water is being relied upon much more than it should be. Jerry Brown, the governor of California, has recently proclaimed a State of Emergency concerning the drought. People are being told to limit public and home water usage but nobody is telling the multi billion dollar agriculture industry to limit their water usage.
All the food that california produces requires water, and lots of it. In fact In total, agriculture consumes 34 million acre-feet of California’s total 43 million acre-feet. An acre foot is about 325,000 gallons of water. Almonds, which are just one of California’s many crops, use approximately 1.1 trillion gallons of water each year. That’s enough water for you to take a 10-minute shower each day for 86 million years!
California’s water intensive crops and livestock are unsustainable in California because Agriculture takes up 80% of california’s total water supply
Scan to learn more.
After I read this, I realized it was too wordy. It was too long and did not fit on my group triangle of the roulette wheel. After showing this version to some fellow students, I also realized that this version would be hard for elementary schoolers to comprehend because it used too many big words. As a result I, once again revised what I wrote. This time I focused on making the content more accessible to elementary schoolers by shortening the length of what I wrote and using simpler language. Here it is, my final version:
Ever wonder how much water is used
to make food in California?
California is the biggest producer of food in the United states. It produces almost all of America’s food including 80% of the country’s strawberries. Agriculture is great for California’s economy, resulting in 46.4 billion dollars of total revenue in 2013.
Unfortunatley, Agriculture is not great for California’s water supply. California is also in the middle of a drought and agriculture’s water use is just making it worse. Each year, agriculture uses 10.5 quadrillion gallons of California’s total 13.975 quadrillion gallons of water. Almonds, which are just one of California’s many crops, use approximately 1.1 trillion gallons of water each year. All the water used for agriculture is absorbed by plants and animals instead of going back into the water cycle. Do you want to know how much water was is in your last meal?
Scan the QR code to find out how much water you eat.
This version of the writing piece for my group triangle of the roulette wheel made sense to my peers and could be understood by elementary schoolers.
Unfortunately, the week of exhibition, Sevilla decided that we would not make a roulette wheel.
The images above are all the versions of my tile design. The first one, the cartoon bull sitting at a table with lots of gallons of water was a good original idea. Bulls and cows are used to make beef. Beef uses the most water, pound for pound, of any other food. This is because, as a result of being the biggest industrially produced animal, cattle eat a lot of corn and corn needs water to grow. Cattle also need water to drink and water to clean their pens. The bull is a great, dramatic, image that illustrates the amount of water that goes into agriculture in California. However, this image was too cartoon-y for the tiles. My Art teacher wanted all of the tiles to have clear, simple images that could be easily understood.
Using my Art teacher's input, I drew a new version of my tile. This time, the bull was more of a silhouette than a cartoon character. I also drew little waves inside the bull to show that the bull was using up water. This image was approved but the caption was not. My teacher wanted all of the words to be below the image. My group fixed this to make the final tile design. This design was the one used for the actual tile.
Using my Art teacher's input, I drew a new version of my tile. This time, the bull was more of a silhouette than a cartoon character. I also drew little waves inside the bull to show that the bull was using up water. This image was approved but the caption was not. My teacher wanted all of the words to be below the image. My group fixed this to make the final tile design. This design was the one used for the actual tile.
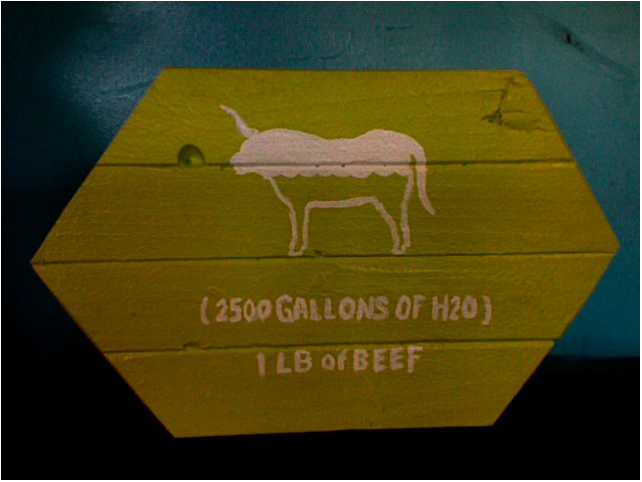
The image above is my group's final tile design. As you can see, this tile went through a long period of re-imagination and revision before the final image and accompanying caption could be completed in a way that communicated our information in a clear and interesting manner. I drew and revised all of the images that went on the tile. Me and John, my partner, also had to actually make the tile. John was in charge of making the tile itself but I helped him out. For example I helped him put the pieces together but he painted the tile alone while I worked on the other part of the project, making our group's video.
